NI LabVIEW Gets RPM Data From Lathe Tachometer Using Panel Meter Communication Library
The Panel Meter Communication Library for LabVIEW from Integrated Pro can be used in many RS-485 communication scenarios common in process control, but it can also be useful in a laboratory test scenario for incorporating RS-485 devices into more traditional testing applications.
An example is the use of the Panel Meter Communication Library for LabVIEW to communicate with a lathe tachometer.

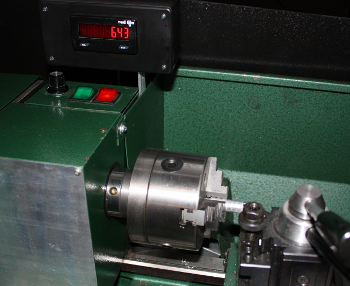
CUB5 counter used as tachometer communicates with NI LabVIEW via RS-485 communication

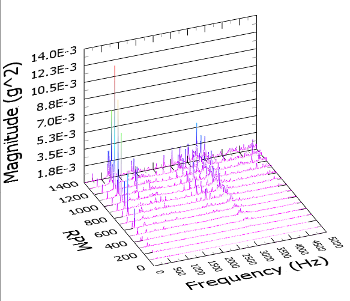
Waterfall plot showing lathe spindle vibration magnitude data vs frequency at different lathe speeds (RPM)
The CUB5 counter has a rate function that is used with a TTL (0-5V) signal from an optical sensor on the lathe spindle to produce a tachometer readout in RPM.
The panel meter is located on the lathe with an RS-485 cable that can be plugged into the computer so that spindle speed can be read into LabVIEW programs.
Incorporating speed data allows vibration data in the frequency domain to be correlated to the running speed of the machine. This can be especially useful for diagnosing vibration issues, or in this case for teaching about vibration testing.
The lab can conduct experiments illustrating run-up or run-down testing, order analysis, cutting chatter vibration or other vibrations that can occur during machining operations. An interesting three-dimensional plot of vibration data is called a waterfall plot, showing how spindle resonances vary with RPM, cutter feed rate and other variables.
Learn more:
- RS-485 Networking Tips
- Read more about the Panel Meter Communication Library for LabVIEW
- Learn about Integrated Pro’s testing services or NI LabVIEW integration services
